
CAGR Explained: What It Means, How to Calculate It, and When to Trust It (2026)
Learn everything about CAGR with simple explanations, formulas, examples, FAQs, and a free calculator for Indian investors in 2026.

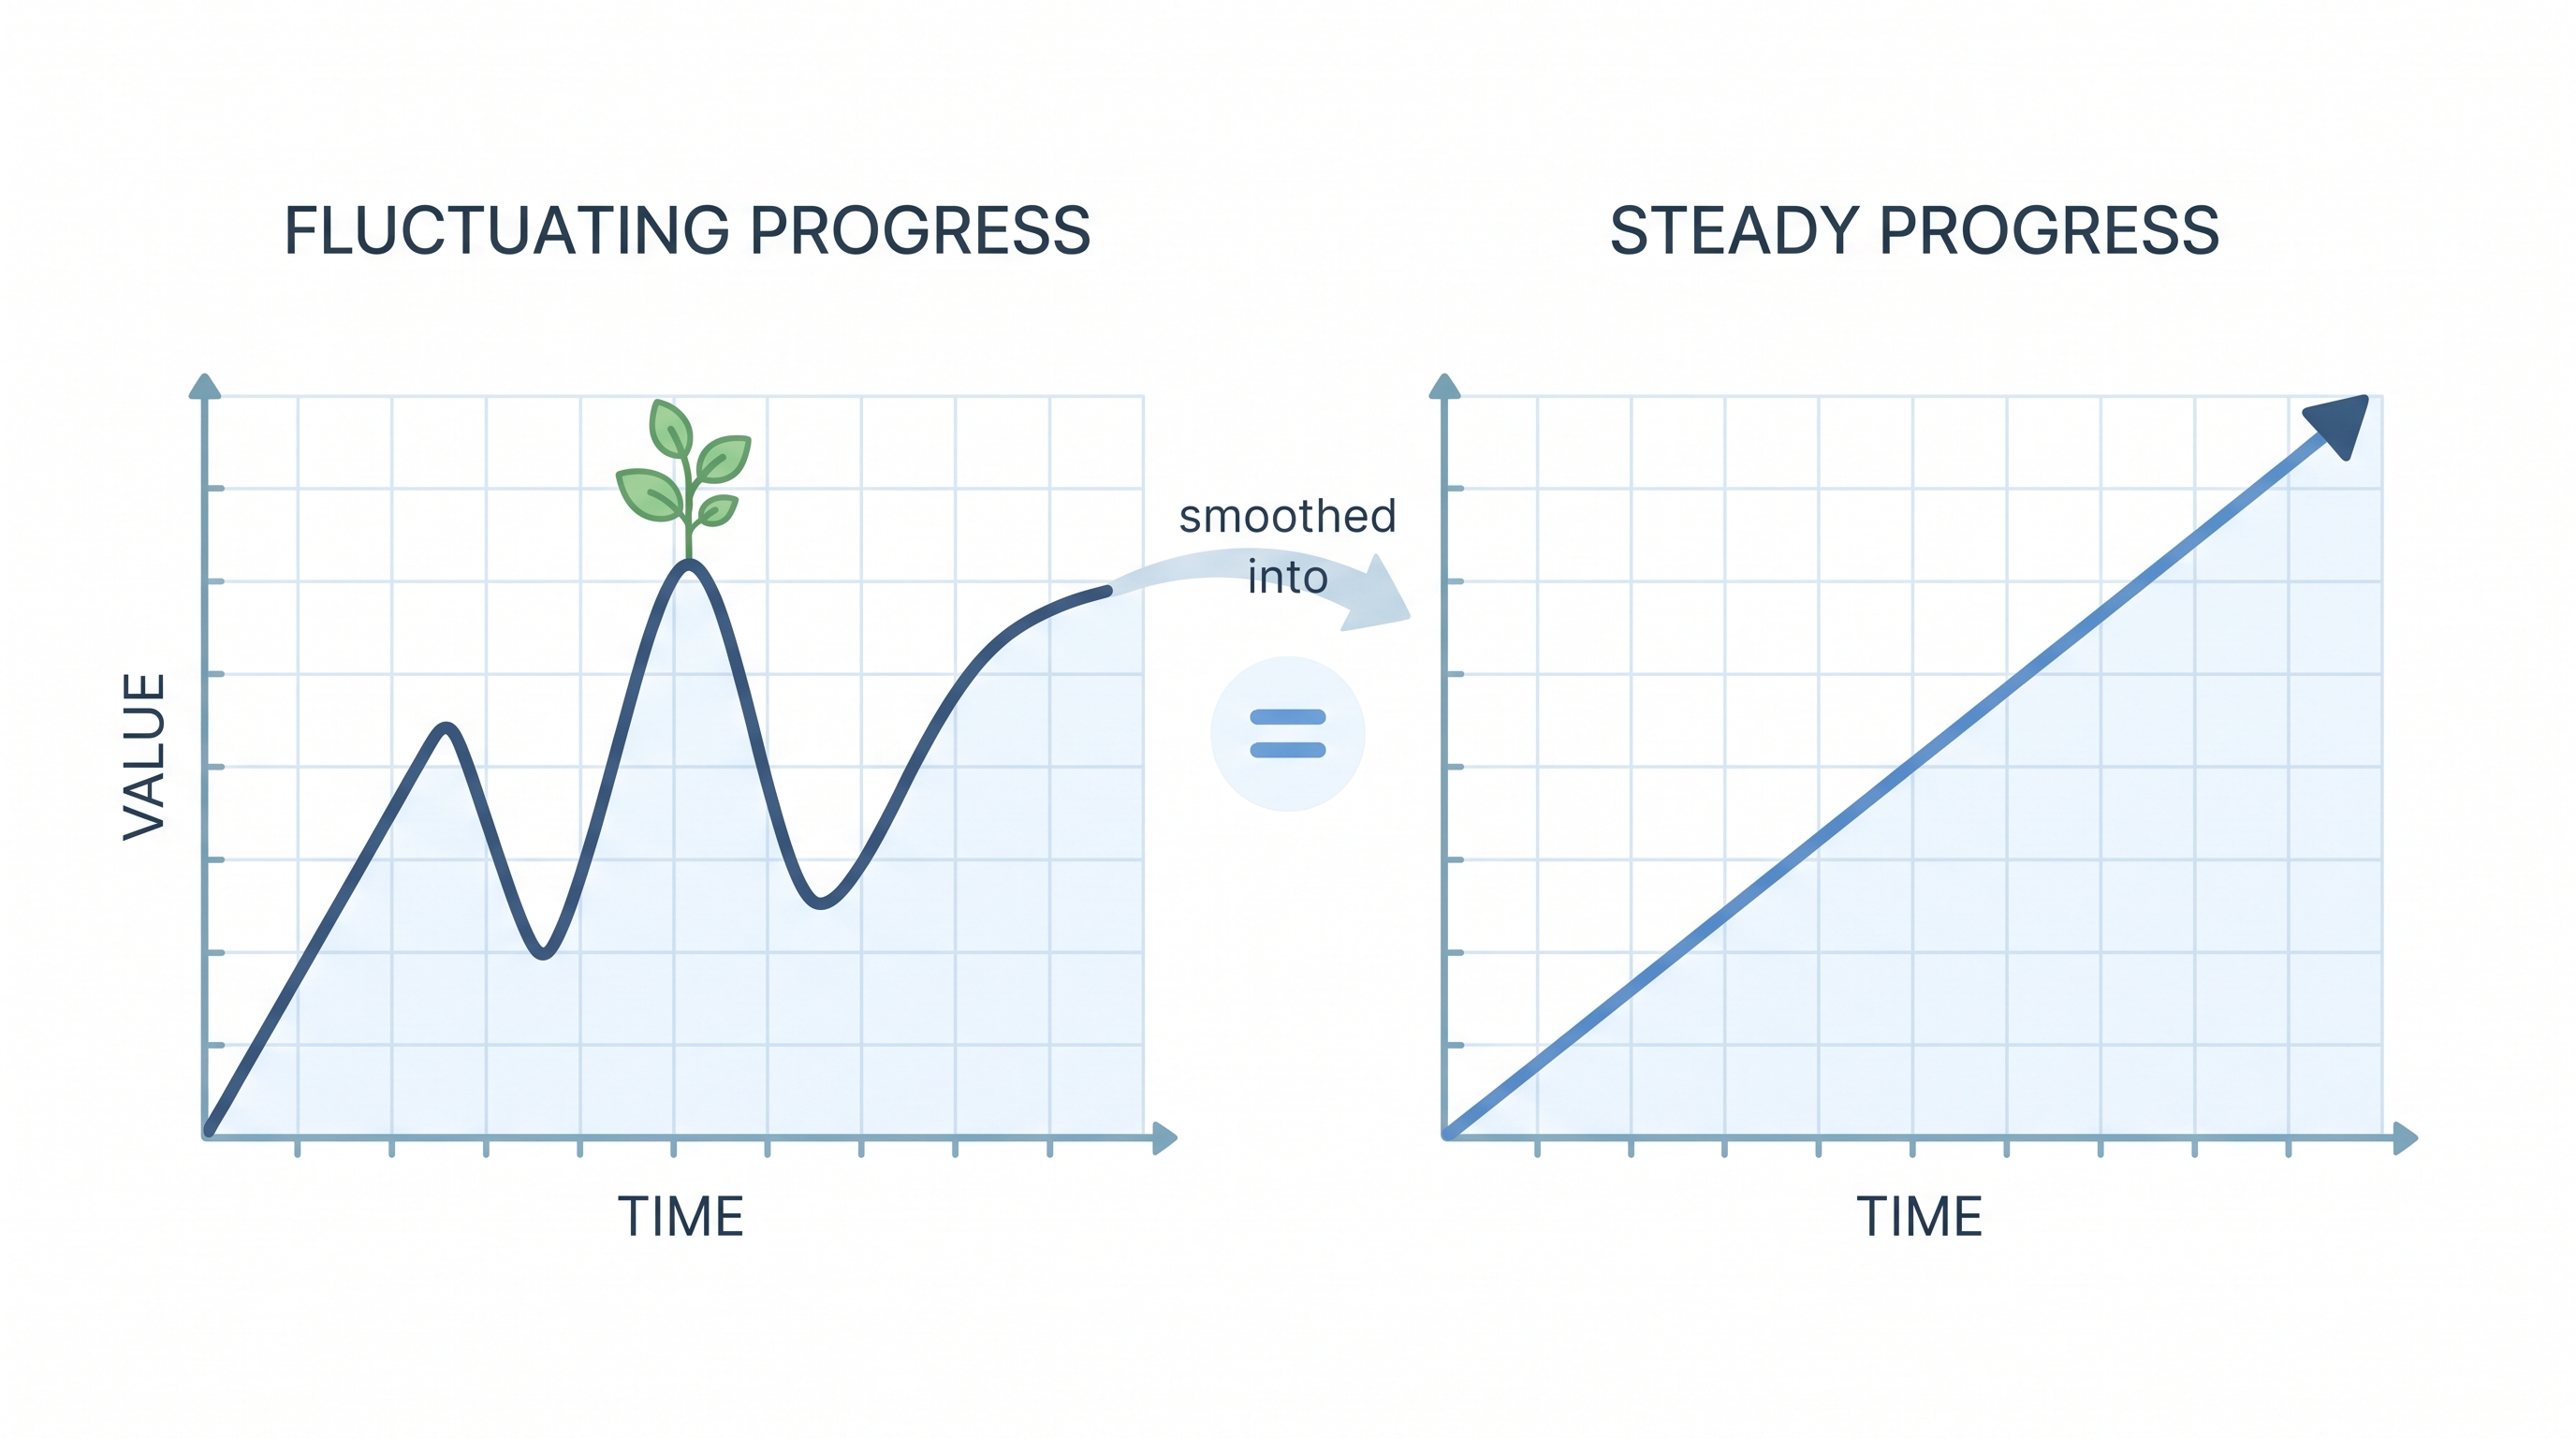
Caption: CAGR smooths out the bumpy years into one steady annual growth number
Table of Contents
- Introduction
- What Is CAGR?
- Key Concepts You Need First
- The CAGR Formula
- Formula Rearrangement
- Step-by-Step Example
- Reference Table
- India Benchmarks
- Interpreting Your CAGR
- Real-Life Examples
- Advantages & Limitations
- CAGR vs Other Metrics
- Common Mistakes
- When NOT to Use CAGR
- Inflation Impact
- Tax Implications
- Practice Questions
- FAQs
Introduction
If you’ve ever looked at a mutual fund page and seen “5Y Return: 15%,” you’ve already seen CAGR in action you just might not have known the name for it. Compound Annual Growth Rate is one of the most commonly quoted numbers in investing, business, and even startup pitch decks, but a lot of people use it without really understanding what it’s smoothing over, or when it can genuinely mislead them.
This guide walks through CAGR in plain language, shows you exactly how to calculate it by hand, gives you real Indian benchmark numbers to compare against, and just as importantly tells you the specific situations where CAGR is the wrong tool for the job.
Definition
CAGR (Compound Annual Growth Rate) is the annualized rate at which an investment would need to grow every single year, compounding steadily, to go from its starting value to its ending value over a given period. It smooths out year-to-year ups and downs into one comparable percentage figure.
Quick Summary (TL;DR)
- CAGR answers one question: “If my investment had grown at the exact same rate every year, what would that rate have been?”
- Formula: CAGR = (Final Value / Initial Value)^(1/Years) − 1
- It only works cleanly for a single lump-sum investment — not for SIPs or irregular deposits (use XIRR for those instead).
- A 12-14% long-term CAGR roughly matches Nifty 50’s historical average; 7-7.1% is typical for safe instruments like PPF.
- CAGR can hide big drawdowns along the way — a smooth-looking 20% CAGR might have included a 50% crash in the middle.
- Rule of 72: divide 72 by your CAGR to estimate how many years it takes your money to double.
Why This Matters
CAGR shows up everywhere once you start looking for it: mutual fund fact sheets, stock screener apps, company annual reports, and even everyday conversations about salary hikes or business growth. Knowing how to calculate it yourself and more importantly, knowing its blind spots means you won’t get fooled by a headline number that looks impressive but hides a rough ride, and you’ll know exactly when to reach for a different metric like XIRR instead.
What Is CAGR? (A Simple Analogy)
Picture your investment as a plant. Some years it shoots up fast, some years it barely grows, and maybe one year it even shrinks a little. CAGR steps back from all that unevenness and asks a single, clean question: “If this plant had grown at the exact same steady rate every single year, what would that rate have been?”
It’s not a real, lived experience no investment actually grows in a perfectly straight line but it’s an extremely useful way to compare your starting point and ending point using one clean, annualized number.
Calculate instantly: CAGR Calculator enter your start value, end value, and number of years to get your CAGR along with a year-by-year breakdown.
Key Concepts You Need First
Before jumping into the formula, it helps to know exactly what each moving part means:
| Term | Meaning |
|---|---|
| Principal / Initial Value (PV) | The amount you originally invested |
| Final Value (FV) | What the investment is worth at the end of the period |
| Years (n) | The total holding period, in years |
| Compounding | Growth calculated on top of previous growth, not just the original amount |
| Annualized Rate | A rate expressed “per year,” even if the actual period is longer or shorter |
The CAGR Formula
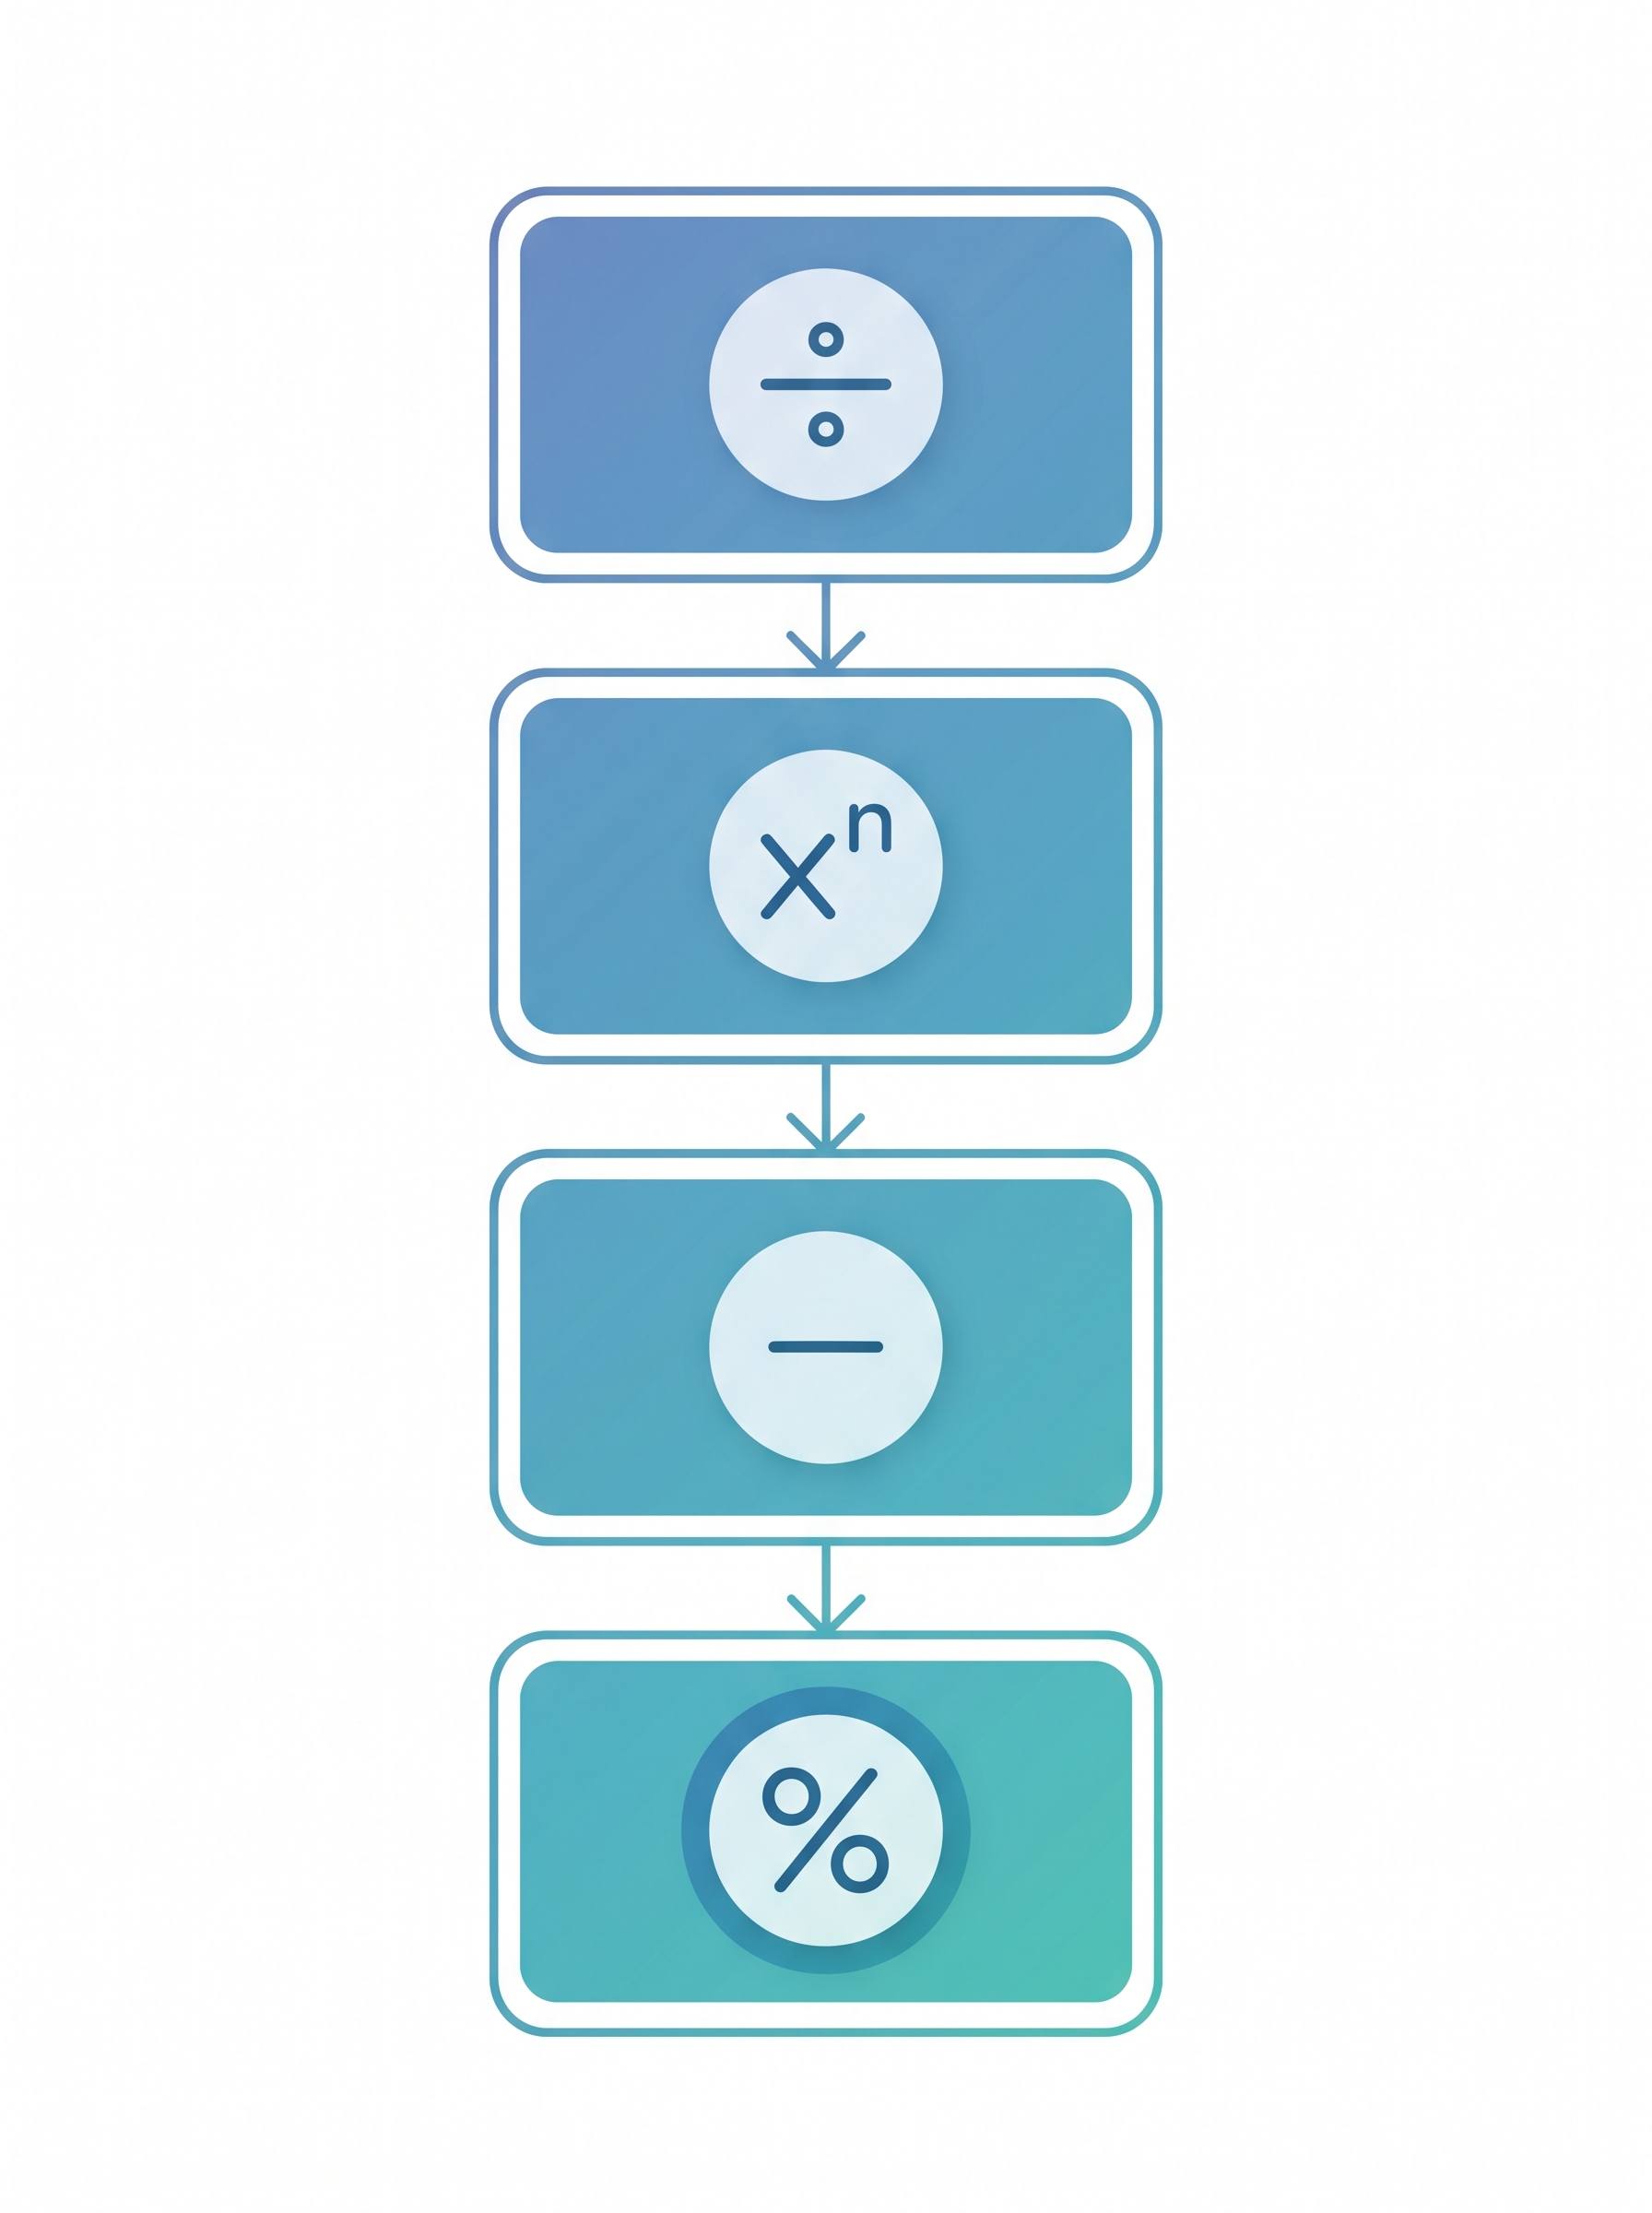
CAGR = (Final Value / Initial Value)^(1/Years) - 1
| Symbol | Meaning |
|---|---|
| FV | Final Value — what your investment is worth today |
| PV | Initial Value — what you originally put in |
| n | Years — how long you’ve held the investment |
Formula Rearrangement (Solving for Other Variables)
Sometimes you know the CAGR and need to solve for something else:
Solving for Final Value:
FV = PV × (1 + CAGR)^n
Solving for Initial Value:
PV = FV / (1 + CAGR)^n
Solving for Years (using logarithms):
n = log(FV / PV) / log(1 + CAGR)
These rearrangements are handy for reverse-planning — for example, figuring out how much you’d need to invest today (PV) to hit a target amount (FV) at an assumed CAGR.
Step-by-Step Worked Example
The problem: You invested ₹1,00,000 in 2020. By 2030, it’s worth ₹2,59,374. What’s the CAGR?
CAGR = (2,59,374 / 1,00,000)^(1/10) - 1
     = (2.59374)^(0.1) - 1
     = 1.10 - 1
     = 0.10
     = 10% per year
Quick check: ₹1,00,000 × 1.10¹⁰ = ₹2,59,374 — the math holds up.
CAGR Reference Table (Common Scenarios)
| Initial (₹) | Final (₹) | Years | CAGR |
|---|---|---|---|
| 1,00,000 | 2,00,000 | 5 | 14.87% |
| 1,00,000 | 2,00,000 | 7 | 10.41% |
| 1,00,000 | 2,00,000 | 10 | 7.18% |
| 1,00,000 | 3,00,000 | 5 | 24.57% |
| 1,00,000 | 3,00,000 | 10 | 11.61% |
| 1,00,000 | 5,00,000 | 10 | 17.46% |
| 1,00,000 | 5,00,000 | 15 | 11.33% |
| 1,00,000 | 10,00,000 | 10 | 25.89% |
| 1,00,000 | 10,00,000 | 20 | 12.20% |
Rule of 72: A quick mental shortcut divide 72 by your CAGR to estimate the number of years it’ll take your money to double. At 12% CAGR, that’s roughly 6 years.
Good CAGR Benchmarks for India
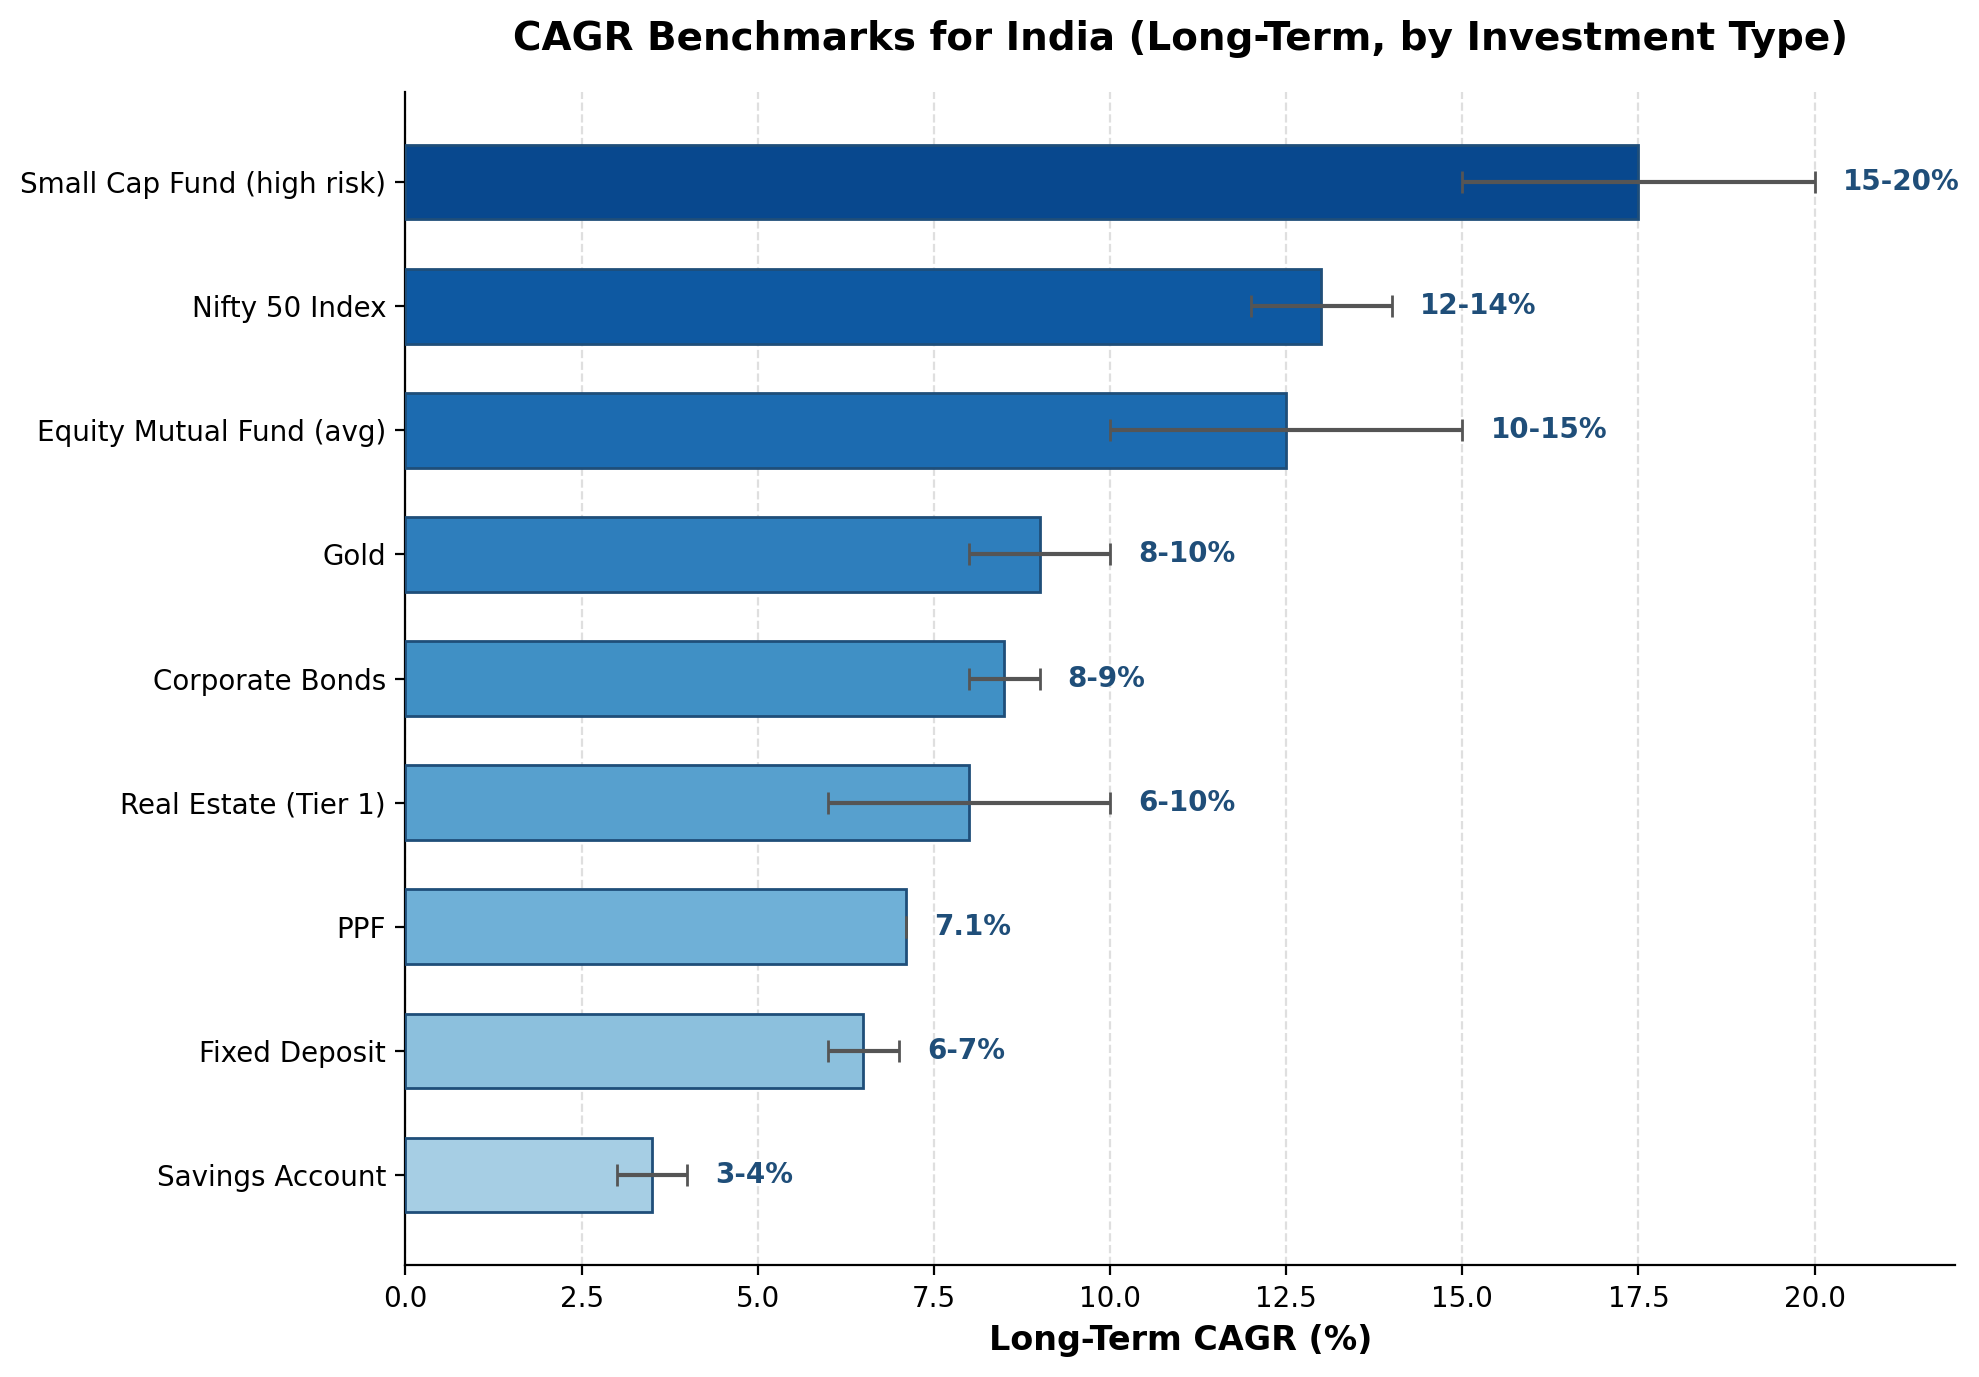
| Investment Type | Expected CAGR (Long-term) |
|---|---|
| Savings Account | 3-4% |
| Fixed Deposit | 6-7% |
| PPF | 7.1% |
| Corporate Bonds | 8-9% |
| Nifty 50 Index | 12-14% |
| Equity Mutual Fund (avg) | 10-15% |
| Small Cap Fund (high risk) | 15-20% |
| Gold | 8-10% |
| Real Estate (Tier 1 cities) | 6-10% |
Note: The PPF rate of 7.1% is confirmed current as of the July–September 2026 quarter and has held steady since April 2020. Since it’s reviewed quarterly by the Ministry of Finance, it’s worth a quick check on the official government site before making long-term planning decisions.
Interpreting Your CAGR: Is It Good?
Once you’ve calculated a CAGR, here’s a rough scale for context (equity-oriented investments, long-term horizon):
| CAGR Range | Interpretation |
|---|---|
| Below 5% | Poor - barely beating or losing to inflation |
| 5-8% | Average - typical of safe debt instruments |
| 8-12% | Good - solid long-term equity or balanced fund performance |
| 12-15% | Very Good - matches or slightly beats broad market indices |
| 15%+ | Excellent - but check the underlying risk and volatility before celebrating |
Real-Life Examples
- A salaried investor puts ₹2,00,000 into an index fund and finds it’s worth ₹4,00,000 seven years later a CAGR of about 10.4%, right in line with long-term equity expectations.
- A small business owner sees revenue grow from ₹50 lakh to ₹1.2 crore over 5 years a revenue CAGR of about 19%, a figure they might use directly in a bank loan application or investor pitch.
- A student saving for higher education puts ₹1,00,000 into a fixed deposit and watches it grow to ₹1,40,000 in 5 years a modest but predictable CAGR of about 7%, appropriate for a short, low-risk goal.
Advantages and Limitations
Advantages:
- Simple, single number that’s easy to compare across investments
- Removes the noise of year-to-year volatility
- Works for any time period, long or short
- Widely understood and used across the finance industry
Limitations:
- Hides drawdowns and volatility that happened along the way
- Only accurate for a single lump-sum investment, not periodic contributions
- Can be misleading over very short time frames
- Doesn’t account for inflation unless separately adjusted
CAGR vs Absolute Return vs XIRR
| Metric | Formula | Best For | Limitation |
|---|---|---|---|
| CAGR | (FV/PV)^(1/n) − 1 | Lump sum, single investment | Hides volatility |
| Absolute Return | (FV−PV)/PV × 100 | Quick profit check | Ignores time |
| XIRR | IRR of cash flows | SIP, multiple investments | More complex to calculate |
| Trailing Return | Based on a specific past period | Fund comparison | Period-dependent |
The rule of thumb to remember: use CAGR for a single lump-sum investment, and use XIRR the moment multiple deposits at different times are involved like a SIP.
Common Mistakes
- Using CAGR for SIP returns : Since SIPs involve multiple deposits at different times, CAGR’s single lump-sum math doesn’t fit; use XIRR instead.
- Ignoring inflation : A 7% CAGR sounds solid until you realize inflation was running at 6%, leaving barely any real growth.
- Comparing CAGRs across different time periods : A 3-year CAGR and a 15-year CAGR aren’t measuring comparable conditions.
- Treating CAGR as a guarantee : it’s a historical or hypothetical smoothing, not a promise of future performance.
- Forgetting that CAGR can be negative : A shrinking investment has a CAGR too, and it’s a valid, useful number to calculate.
When CAGR Isn’t the Right Tool
CAGR is genuinely useful, but it has real blind spots worth knowing before you lean on it too heavily:
- SIP investments : since you’re investing at different times with different market conditions each time, CAGR can’t account for that properly; XIRR is built for exactly this situation.
- Short holding periods : a CAGR calculated over less than a year gets mathematically stretched into an annualized figure that can look dramatically higher or lower than reality.
- Highly volatile assets : CAGR only looks at the start and end points, so it completely hides what happened in between. A crypto asset might show a smooth-looking 30% CAGR while having actually crashed 80% at some point along the way.
- Comparing across different time periods : a 3-year CAGR and a 10-year CAGR aren’t apples-to-apples; longer periods tend to smooth out short-term volatility in ways shorter periods can’t.
Negative CAGR Example
Not every CAGR story is a happy one here’s what a loss looks like using the same formula.
The problem: ₹5,00,000 invested, now worth ₹3,00,000 after 4 years.
CAGR = (3,00,000 / 5,00,000)^(1/4) - 1
     = (0.6)^(0.25) - 1
     = 0.88 - 1
     = -12% per year
That means the investment lost roughly 12% of its value annually, on a compounded basis a useful reminder that CAGR works exactly the same way in both directions.
Inflation Impact: Nominal vs Real CAGR
The CAGR you calculate from raw numbers is your nominal CAGR it doesn’t account for inflation eating into your purchasing power. To find your real CAGR (what you actually gained in purchasing power), use:
Real CAGR ≈ Nominal CAGR − Inflation Rate
Example: If your investment’s nominal CAGR is 10% and inflation averaged 6% over that period, your real CAGR is roughly 4% meaning your actual purchasing power grew at about 4% per year, not 10%.
| Nominal CAGR | Inflation | Approx. Real CAGR |
|---|---|---|
| 7% | 6% | ~1% |
| 10% | 6% | ~4% |
| 14% | 6% | ~8% |
Tax Implications (India)
Tax treatment depends on the investment type, not on CAGR itself CAGR is just a growth metric, not a taxable event. A few general pointers for FY 2026-27:
- Equity mutual funds / stocks: Long-term capital gains (holding period over 1 year) are taxed under current capital gains rules; short-term gains are taxed at a higher rate. Always check the latest rates on the Income Tax Department’s official site, since these are periodically revised.
- PPF: Fully tax-free under the EEE (Exempt-Exempt-Exempt) structure no tax on contribution, interest, or maturity.
- Fixed Deposits: Interest is fully taxable as per your income slab.
- Debt mutual funds: Taxed as per your income slab, following recent regulatory changes to debt fund taxation.
This section is for general awareness only always verify current tax rules with a qualified tax professional or the official Income Tax Department website before filing.
Practice Questions
- ₹50,000 grows to ₹1,00,000 in 6 years. What’s the CAGR?
- If an investment has a CAGR of 15% over 8 years, roughly how many years would it take to double using the Rule of 72?
- Why would XIRR be more appropriate than CAGR for a monthly SIP?
- ₹2,00,000 shrinks to ₹1,50,000 over 3 years. Is the CAGR positive or negative, and roughly what is it?
- Why can’t you directly compare a 3-year CAGR to a 15-year CAGR?
(Answers: 1. ≈12.25% 2. 72 ÷ 15 ≈ 4.8 years 3. Because SIP involves multiple cash flows at different times, which CAGR’s single lump-sum formula can’t account for 4. Negative, roughly −9.14% 5. Because shorter periods are far more sensitive to short-term market swings, while longer periods smooth that volatility out — the two numbers aren’t measuring comparably stable conditions)
Frequently Asked Questions
Can CAGR be used for business revenue growth?
Yes, CAGR is widely used to measure revenue, profit, and user base growth in business contexts. “Our revenue CAGR over 5 years is 25%” is standard startup and investor language.
What is the Rule of 72?
Divide 72 by the CAGR to estimate how many years it takes to double your money. At 8% CAGR, that’s 72 ÷ 8 = 9 years to double. At 15%, it’s roughly 4.8 years.
Is 12% CAGR good in India?
For equity investments, a 12% CAGR sustained over 10+ years is considered good it roughly matches the Nifty 50’s historical long-term average. For debt instruments, 7-8% is considered solid. Either way, it’s worth comparing against inflation, which typically runs around 5-6% in India.
How do mutual fund websites show CAGR?
They usually label it as “1Y Return,” “3Y Return,” or “5Y Return” these are all CAGR figures calculated for that specific period. A “5Y Return of 15%” simply means the fund grew at a 15% CAGR over the last five years.
CAGR vs IRR — what’s the difference?
CAGR assumes a single lump-sum investment made at the start. IRR (Internal Rate of Return) is built to handle multiple cash flows happening at different times. For a single lump-sum investment with no additional deposits, CAGR and IRR actually work out to be the same number.
Can CAGR be negative?
Yes. If your investment’s final value is lower than what you started with, CAGR will be negative it simply reflects the annualized rate of loss, calculated with the same formula.
Why is CAGR better than a simple average return?
A simple average of yearly returns can be misleading because it ignores compounding a year with +50% followed by a year with −50% doesn’t average to 0% in real terms; you’d actually be down 25% overall. CAGR captures this compounding effect accurately, while a simple average does not.
Related Concepts
- Absolute Return : Total percentage gain without factoring in time.
- XIRR : The right tool for irregular or multiple cash flows (like SIPs).
- Inflation : The silent factor that erodes your real (purchasing-power-adjusted) returns.
- Risk & Volatility : The year-to-year swings that CAGR smooths over and hides.
- Diversification : Spreading investments to manage the risk that a single CAGR figure can’t reveal
Historical Performance Context
Over the past two decades, India’s benchmark equity indices have delivered long-term CAGRs broadly in the 12-14% range, though with considerable year-to-year variation including multiple years of sharp declines followed by strong recoveries. This underscores why CAGR should always be viewed alongside the underlying volatility, not as a standalone guarantee of a smooth ride.
Expert Tips
- Always pair a CAGR figure with the investment’s volatility or maximum drawdown for full context.
- Use CAGR to compare similar time horizons only don’t stack a 3-year figure against a 10-year one.
- For SIPs, always ask for the XIRR, not the CAGR, when evaluating fund performance.
- Adjust for inflation before deciding whether a CAGR is genuinely “good.”
- Treat historical CAGR as informative, not predictive past compounding doesn’t guarantee future compounding.
Financial Disclaimer
This article is for educational purposes only and should not be considered financial advice. Investment decisions should be made after consulting a qualified financial advisor and reviewing current, official rate information.
Conclusion
CAGR is one of the simplest, most widely used tools in investing precisely because it turns a messy, up-and-down growth story into one clean annual number you can compare across investments. But that simplicity is also its biggest limitation it smooths over the bumps, and sometimes those bumps matter more than the tidy final percentage suggests. Use it confidently for lump-sum comparisons, lean on XIRR the moment SIPs or irregular investments are involved, and always remember to ask what happened between the start and end points, not just what the two endpoints were.
Related Tools
Related Articles
Sources
- Ministry of Finance, Government of India small savings scheme interest rate notifications
- Income Tax Department of India (incometax.gov.in) capital gains tax rules
- AMFI (Association of Mutual Funds in India) mutual fund return reporting standards
- NSE/BSE historical index data for benchmark index performance context
Free tools
Learn faster with Numverto
Free number system converters, binary tools, EMI calculators, and more, with step-by-step working.
Written by

By : Mannu Kumar
Founder of Numverto. MCA graduate, full-stack developer, and lifelong learner who built this platform so every student gets the explanation, not just the answer.
Related tools
More from Numverto Blog
ieee754
IEEE 754 Floating Point Explained Sign, Exponent & Mantissa
Master IEEE 754 floating point format sign, exponent, mantissa explained with real conversion examples for exams and coding interviews.
13 July 2026
IEEE 754 Standard
Why Does 0.1 + 0.2 Equal 0.30000000000000004? Floating-Point Errors Explained
Understand why computers produce floating-point precision errors, how the IEEE 754 standard stores decimal numbers in binary, why rounding occurs, and the best practices developers use to write accurate, reliable code.
1 July 2026
Discussion